Conditional probability with tree diagrams
Table of Contents
Table of Contents
Have you ever found yourself stuck trying to calculate the probability of an event based on another event? This is where Conditional Probability Tree Diagram comes in handy! By laying out the possible outcomes in a tree diagram, you can easily determine the probability of complex events.
We all know that probability can be a challenging topic, especially when we start dealing with multiple events. It can be time-consuming and confusing to determine the probability of an event that is dependent on another event. Conditional Probability Tree Diagram helps to simplify this process by breaking down the events into smaller, more manageable pieces.
The target of Conditional Probability Tree Diagram is to determine the probability of an event that is dependent on another event. For instance, if you want to know the probability of an event A happening given that event B has already occurred, Conditional Probability Tree Diagram can help you calculate this probability quickly and accurately.
In summary, Conditional Probability Tree Diagram is an essential tool in determining the probability of complex events. By visually laying out the possible outcomes in a tree diagram, we can easily calculate the probability of an event that is dependent on another event.
Understanding Conditional Probability Tree Diagram
When I started learning about Conditional Probability Tree Diagram in my statistics class, I was initially overwhelmed by the amount of information. However, with practice, I quickly realized how useful this tool can be. The tree diagram helped me to see the different outcomes clearly, allowing me to determine the probability of each possible event.
Conditional Probability Tree Diagram involves creating a decision tree to represent the possible outcomes of an event. Each branch of the tree represents a possible outcome, with the probability of that outcome written next to it. By multiplying the probabilities along each branch, we can determine the overall probability of a specific event.
Steps to Creating Conditional Probability Tree Diagram
To create a Conditional Probability Tree Diagram, you need to follow these steps:
Step 1: Define the Events
The first step is to define the events you want to analyze. For example, you might want to determine the probability of a student passing math if they attended tutoring sessions.
Step 2: Create the First Branch
The next step is to create your first branch, representing the probability of the first event occurring. This could be the probability of attending tutoring sessions.
Step 3: Create the Second Branch
The second branch represents the probability of the second event occurring. Since you want to determine the probability of passing math with tutoring, this branch represents the probability of passing math.
Step 4: Calculate Probabilities
You can then calculate the probability of each possible outcome by multiplying the probabilities along each branch.
Benefits of Using Conditional Probability Trees
The conditional Probability Tree Diagram allows you to calculate the probability of an event more accurately and efficiently than other methods. It also provides a visual representation of the possible outcomes, making the decision-making process easier.
Real-Life Applications of Conditional Probability
Conditional Probability Tree Diagram has various applications in real life. For example, businesses can use it to analyze their sales data and demographics to determine the likelihood of a customer returning to make another purchase. Governments can also use it to analyze crime data to determine the probability of a crime being solved based on various factors.
Question and Answer Section
Q. What is Conditional Probability Tree Diagram?
A. Conditional Probability Tree Diagram is a visual representation of the possible outcomes of an event dependent on other events. It enables you to calculate the probability of complex events accurately.
Q. When should a Conditional Probability Tree Diagram be used?
A. Conditional Probability Tree Diagram is best used when you’re analyzing the probability of an event dependent on other events. It enables you to see the possible outcomes visually, making it easier to calculate the probability.
Q. How does Conditional Probability Tree Diagram simplify the probability calculation process?
A. Conditional Probability Tree Diagram simplifies the probability calculation process by breaking down complex events into smaller, more manageable pieces. By representing the possible outcomes visually, it makes it easier to calculate the probability of various outcomes.
Q. Are there any alternative methods of calculating conditional probability?
A. Yes. Bayes’ theorem is another method of calculating conditional probability. It uses prior knowledge of the event to determine the likelihood of a specific outcome.
Conclusion of Conditional Probability Tree Diagram
Conditional Probability Tree Diagram is a powerful tool that simplifies the complex process of calculating the probability of events dependent on other events. Its visual representation of the possible outcomes makes it easier to calculate the probability accurately and efficiently. Whether you’re analyzing data for a business or studying for a math test, Conditional Probability Tree Diagram can be a helpful resource.
Gallery
Conditional Probability With Tree Diagrams - YouTube

Photo Credit by: bing.com / probability tree conditional diagrams
Mr Rouche’s Maths: Conditional Probability Trees
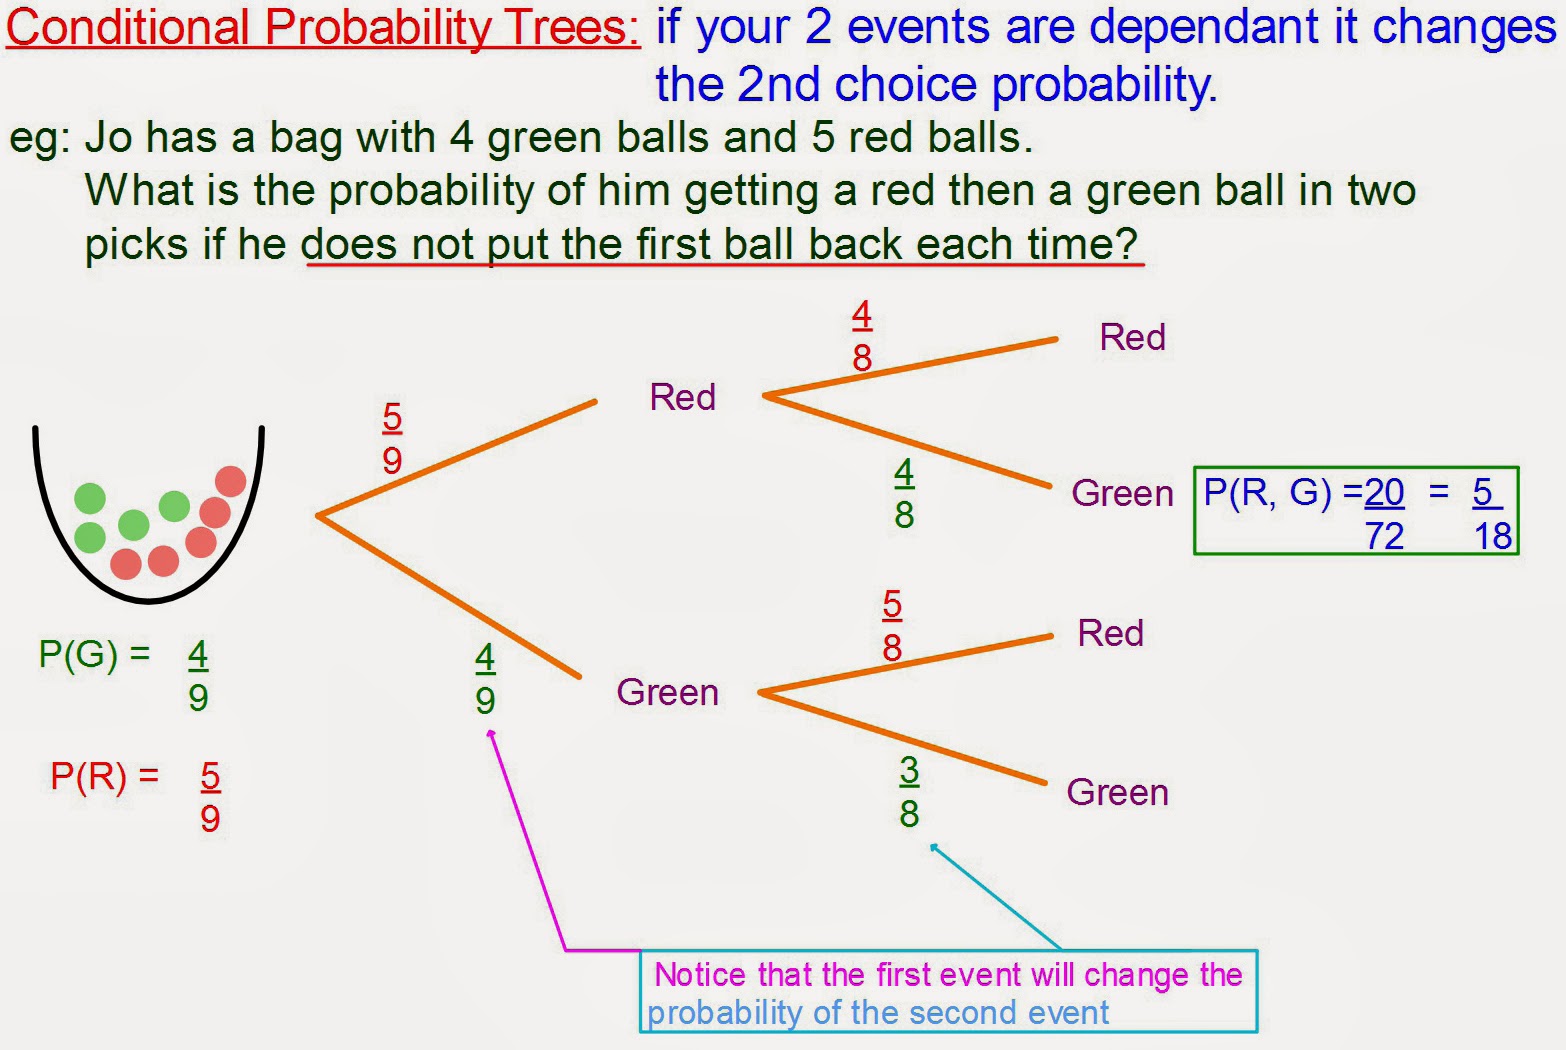
Photo Credit by: bing.com / conditional probability maths
Probability Tree Diagrams In R – Harry Surden
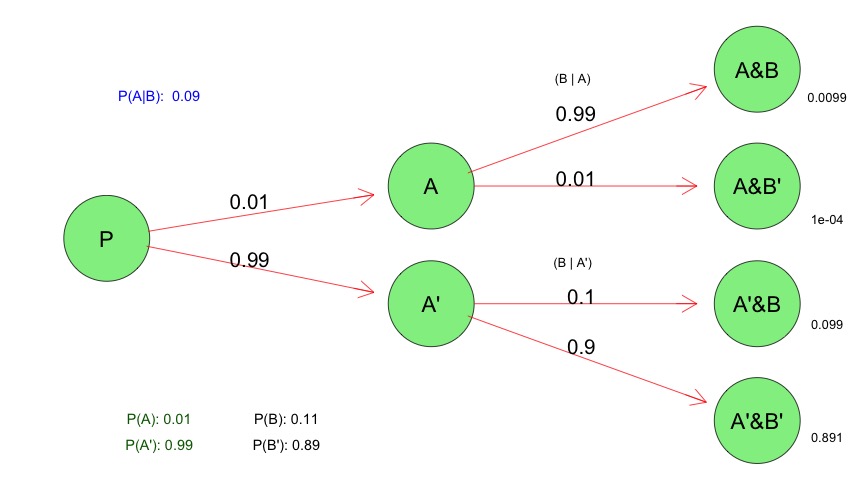
Photo Credit by: bing.com / probability conditional
Tree Diagram For Calculation Of The Conditional Probability ) 2

Photo Credit by: bing.com / probability conditional calculation
Total Probability Formula - Conditional Probability

Photo Credit by: bing.com / probability total conditional formula tree diagram probabilities paths highlighting key


