Basic statistics probability formulas
Table of Contents
Table of Contents
Are you struggling to calculate probability for normal distribution? Do you find the formula complex and confusing? Look no further, as we break down the formula and provide step-by-step instructions to make the process easier.
Many individuals find calculating probability for normal distribution to be a daunting task. Whether you are a student studying statistics or a professional needing to make decisions with data, the formula can be overwhelming. Understanding the calculations and knowing when to use them can be a headache. However, with a little bit of practice and guidance, the formula can be simplified.
The formula to calculate probability for normal distribution is used to find the probability that a certain value will occur within a specified range. This is useful in a variety of scenarios, such as analyzing test scores or predicting stock prices. The formula is based on the concept of the normal distribution, which is a bell-shaped curve that represents the distribution of data in many real-world situations.
To use the formula, you first need to know the mean and standard deviation of the data set. Once you have those values, you can use the formula to calculate the probability of a certain value occurring within a specified range. The formula looks complex at first glance, but with practice, it becomes easier to understand.
Understanding the Formula To Calculate Probability For Normal Distribution
As mentioned earlier, the formula to calculate probability for normal distribution is based on the normal distribution curve, also known as the bell curve. The bell curve represents the distribution of data in many real-world situations. The curve is symmetrical, with the mean, median, and mode all being the same value.
The formula to calculate probability for normal distribution is:

The formula may look complex, so let’s break it down. The first part of the formula, (x-μ)/σ, calculates the z-score. The z-score represents the number of standard deviations that a certain value is away from the mean. The second part of the formula, 1 / (σ * sqrt(2π)), calculates the standard normal distribution. This value accounts for the entire area under the curve and ensures that the total probability equals 1.
Step-by-Step Guide for Calculating Probability for Normal Distribution
Here is a step-by-step guide to help you calculate probability for normal distribution:
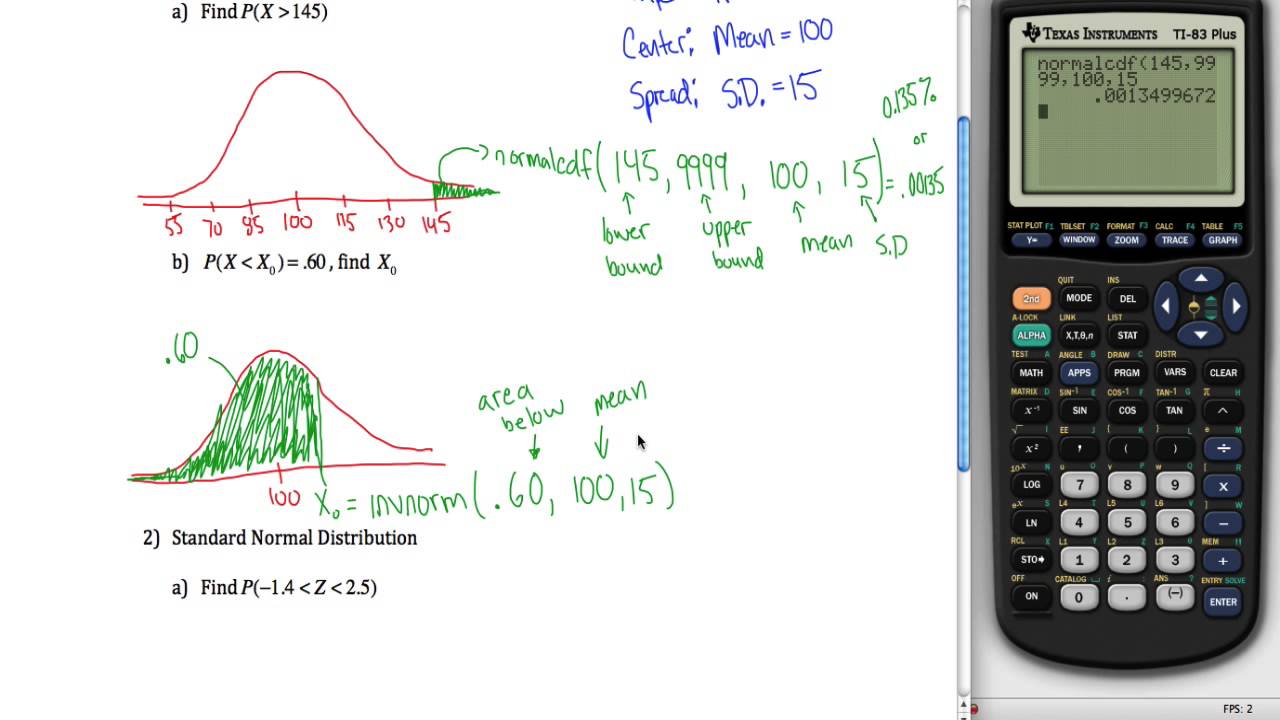
- Identify the mean and standard deviation of the data set.
- Determine the range of values for which you want to calculate the probability.
- Calculate the z-score using the formula (x-μ)/σ.
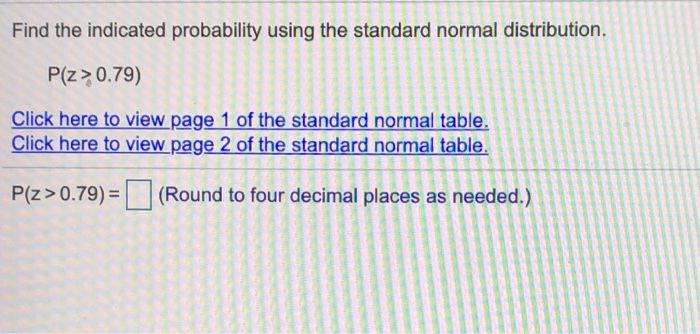
- Use a z-table or statistical software to find the area under the curve corresponding to the z-score.
- Calculate the probability by multiplying the area under the curve by 100%.
Benefits of Understanding the Formula To Calculate Probability For Normal Distribution
Understanding the formula to calculate probability for normal distribution has many benefits. It allows you to make better decisions based on data and provides insight into how data is distributed. By knowing the probability of a certain value occurring within a range, you can make informed decisions and predictions. Additionally, understanding the formula is useful for students studying statistics and for professionals in fields such as finance and science.
Additional Tips for Using the Formula To Calculate Probability For Normal Distribution
Here are a few additional tips to keep in mind when using the formula to calculate probability for normal distribution:
- Make sure that your data follows a normal distribution before using the formula.
- Use a z-table or statistical software to find the area under the curve if you don’t have access to a calculator.
- Double-check your calculations to ensure accuracy.
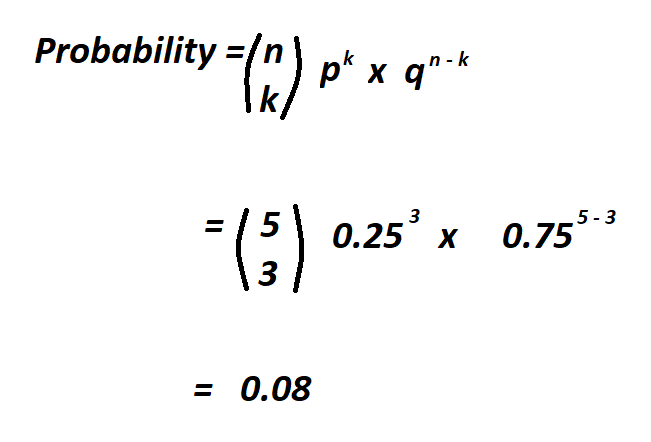
Practice Example:
To further understand the formula, let’s look at an example. Say we have a data set of exam scores with a mean of 75 and a standard deviation of 10. We want to find the probability of a student scoring between 70 and 85. Using the formula, we can calculate the z-score as follows:
((85-75)/10)= 1
((70-75)/10)= -0.5
We can then use a z-table or statistical software to find the area under the curve corresponding to each z-score. The area for a z-score of 1 is 0.8413, and the area for a z-score of -0.5 is 0.3085. To find the probability of a student scoring between 70 and 85, we subtract the area for the lower z-score from the area for the higher z-score:
0.8413 - 0.3085 = 0.5328
Therefore, the probability of a student scoring between 70 and 85 on the exam is 53.28%.
Question and Answer Section
Q1: What is the normal distribution curve?
A1: The normal distribution curve, also known as the bell curve, represents the distribution of data in many real-world situations. The curve is symmetrical, with the mean, median, and mode all being the same value.
Q2: What is the formula to calculate probability for normal distribution?
A2: The formula to calculate probability for normal distribution is based on the normal distribution curve and is: P(x) = 1 / (σ * sqrt(2π)) * e^(-0.5((x-μ)/σ)^2).
Q3: What does the z-score represent?
A3: The z-score represents the number of standard deviations that a certain value is away from the mean.
Q4: What are some benefits of understanding the formula to calculate probability for normal distribution?
A4: Understanding the formula to calculate probability for normal distribution allows you to make better decisions based on data and provides insight into how data is distributed. By knowing the probability of a certain value occurring within a range, you can make informed decisions and predictions.
Conclusion of Formula To Calculate Probability For Normal Distribution
Calculating probability for normal distribution may seem daunting at first, but with practice and guidance, it becomes easier. Understanding the formula and the concept of the normal distribution curve allows you to make informed decisions based on data, making it a valuable tool for students and professionals alike. Keep in mind the tips mentioned above and always double-check your calculations for accuracy. With a little bit of practice, you will become a pro at calculating probabilities for normal distribution.
Gallery
Basic Statistics & Probability Formulas - PDF Download

Photo Credit by: bing.com / probability distribution formula normal statistics gaussian calculator formulas pdf basic
Normal Distribution: Calculating Probabilities/Areas (z-table) - YouTube
 - YouTube")
Photo Credit by: bing.com / distribution normal table calculating probabilities areas
Probability Distribution Formula | Examples With Excel Template

Photo Credit by: bing.com / probability distribution formula excel finance examples
Normal Distribution Formula (Step By Step Calculations)
")
Photo Credit by: bing.com /
Formula For The Normal Distribution Or Bell Curve
Photo Credit by: bing.com / distribution formula normal curve bell statistics excel reorder quantity equation probability distribucion curves fabtemplatez calculus